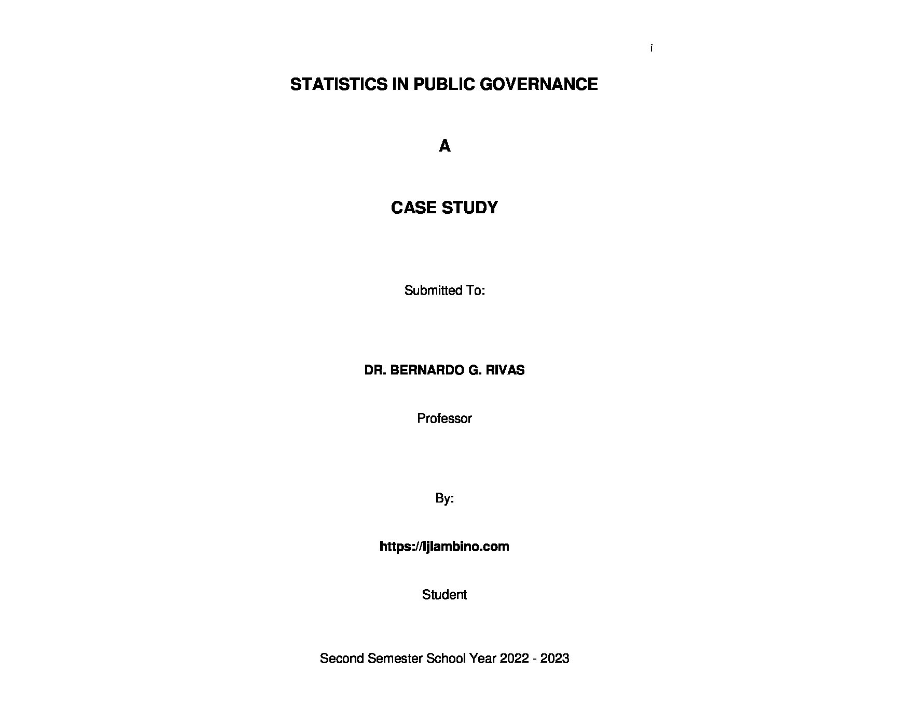
If you are seeking guidance on creating a case study in Statistics, particularly for your Master’s course, this resource may assist you in simplifying the process.
I hope this article can serve as a helpful guide on how to create a case study in Statistics. Many individuals may have limited knowledge on this topic, so feel free to check out the article and see if it can assist you in completing your project successfully.

CONTENTS
Background of the Company
Presentation of Case Study
A. Background
B. Methods
C. Results of the Study
C.1 Data Presentation
C.1.1 Age Tabular Form
C.1.2 Salary Pie Graph
C.1.3 Years of Experience Pictograph
C.1.4 Salary Histogram
C.1.5 Salary Frequency Polygon
C.1.6 Salary Ogive
C.2 Measures of Central Tendency
C.2.1 Mean, Median, Mode for Ungrouped Data
C.2.1.1 Age – Mean
C.2.1.2 Age – Median
C.2.1.3 Age – Mode
C.2.1.4 Salary – Mean
C.2.1.5 Salary – Median
C.2.1.6 Salary – Mode
C.2.1.7 Years of Experience – Mean
C.2.1.8 Years of Experience – Median
iv
C.2.1.9 Years of Experience – Mode
C.2.2 Mean, Median Mode For Grouped Data
C.2.2.1 Age and Sex Disaggregated Data – Mean, Median,
Mode
C.2.3 Weighted Mean for Job Factor
C.3 Fractiles for Ungrouped Data
C.3.1 Age – Q1 and Q3, D3 and D7, P35 and P75
C.3.2 Salary – Q1 and Q3, D3 and D7, P35 and P75
C.3.3 Years of Experience – Q1 and Q3, D3 and D7, P35 and
P75
C.4 Fractiles for Grouped Data
C.4.1 Salary – Q1 and Q3, D3 and D7, P35 and P75
C.5 Measures of Variability for Ungrouped Data
C.5.1 Age – Range, Percentile Range, Quartile Deviation,
Sample Variance, Standard Deviation
C.5.2 Salary – Range, Percentile Range, Quartile Deviation,
Sample Variance, Standard Deviation
C.5.3 Years of Experience – Range, Percentile Range,
Quartile Deviation, Sample Variance, Standard Deviation
C.6 Measures of Variability for Grouped Data
C.6.1 Salary – Range, Percentile Range, Quartile Deviation,
Sample Variance, Standard Deviation
C.7 Skewness and Kurtosis for Ungrouped Data
C.7.1 Age
C.7.2 Salary
C.7.3 Years of Experience
C.8 Skewness and Kurtosis for Grouped Data
C.8.1 Salary
C.9 Correlation Analysis
v
C.9.1 Spearman Rack Difference
C.9.2 Pearson Product Moment Formula
C.10 Regression Analysis
C.10.1 Years of Experience vs. Salary
Self-Reflection
Attachments
DOWNLOADS
Title Page – click here or go to https://ljlambino.com/wp-content/uploads/2023/07/STATISTICS-IN-PUBLIC-GOVERNANCE-CASE-STUDY-title.pdf
Main Content – click here or go to https://ljlambino.com/wp-content/uploads/2023/07/STATISTICS-IN-PUBLIC-GOVERNANCE-CASE-STUDY.pdf
Questionnaire – click here or go to https://ljlambino.com/wp-content/uploads/2023/07/A-brief-survey-for-my-masters-course-in-Statistics-for-Public-Administration.pdf
Don’t forget to follow my Facebook page and subscribe to my YouTube channel for updates and new content, and to show appreciation for the free research paper. Your support is greatly appreciated!
